Portfolio Intelligence
Your programme control hub. Everything, everywhere, in one view.
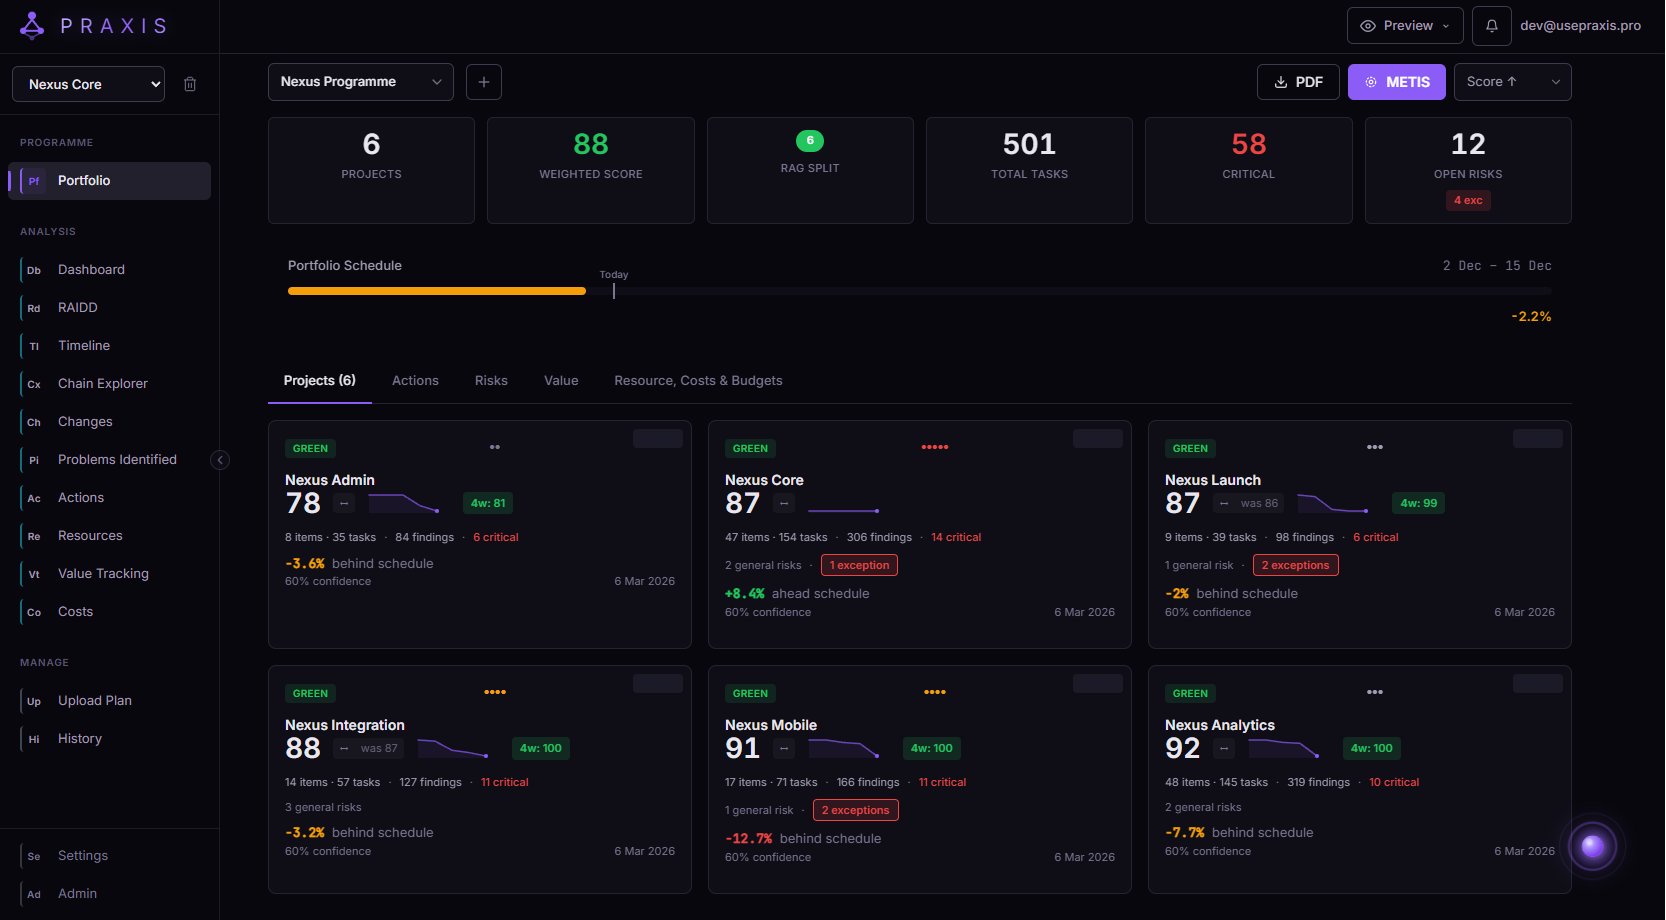
This is the programme manager's command centre. See health scores, trends, critical findings, and exception risks across every project in your portfolio. Find weak points. Spot efficiency gains. Track value delivery, budgets, forecasts, and resource contention — all from a single screen. No switching between tools. No chasing updates. The data updates in real-time as teams work.
6 projects, 501 tasks, 88 weighted score — with floor rules that prevent Green projects masking Red
Health sparklines, critical findings, exception risks, schedule deltas — per project
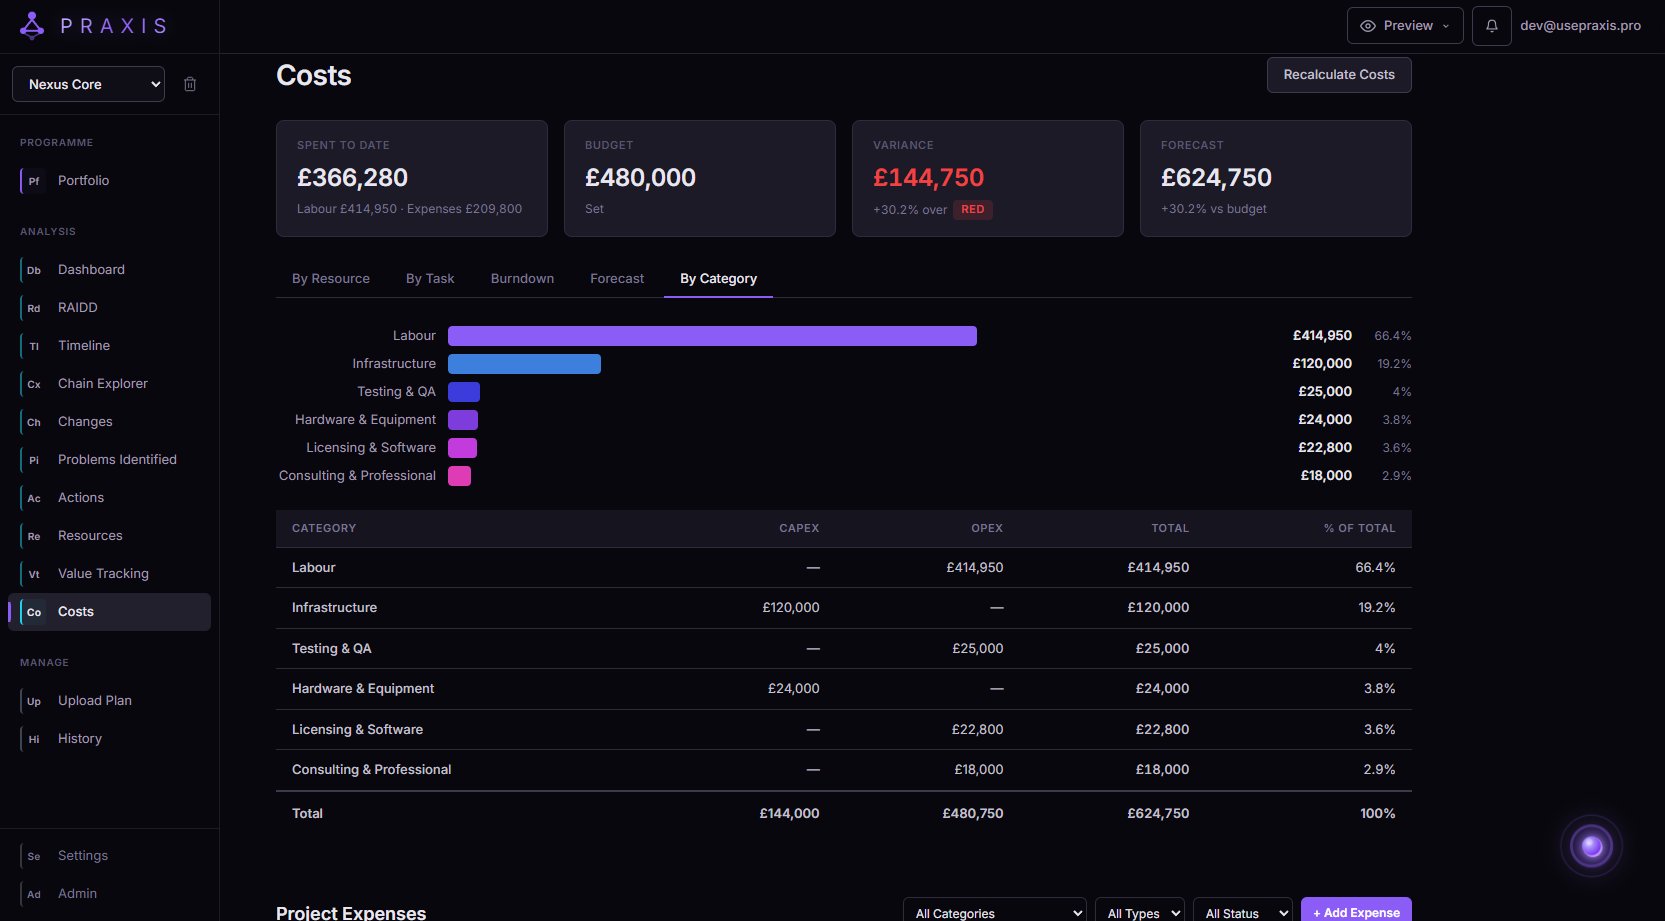
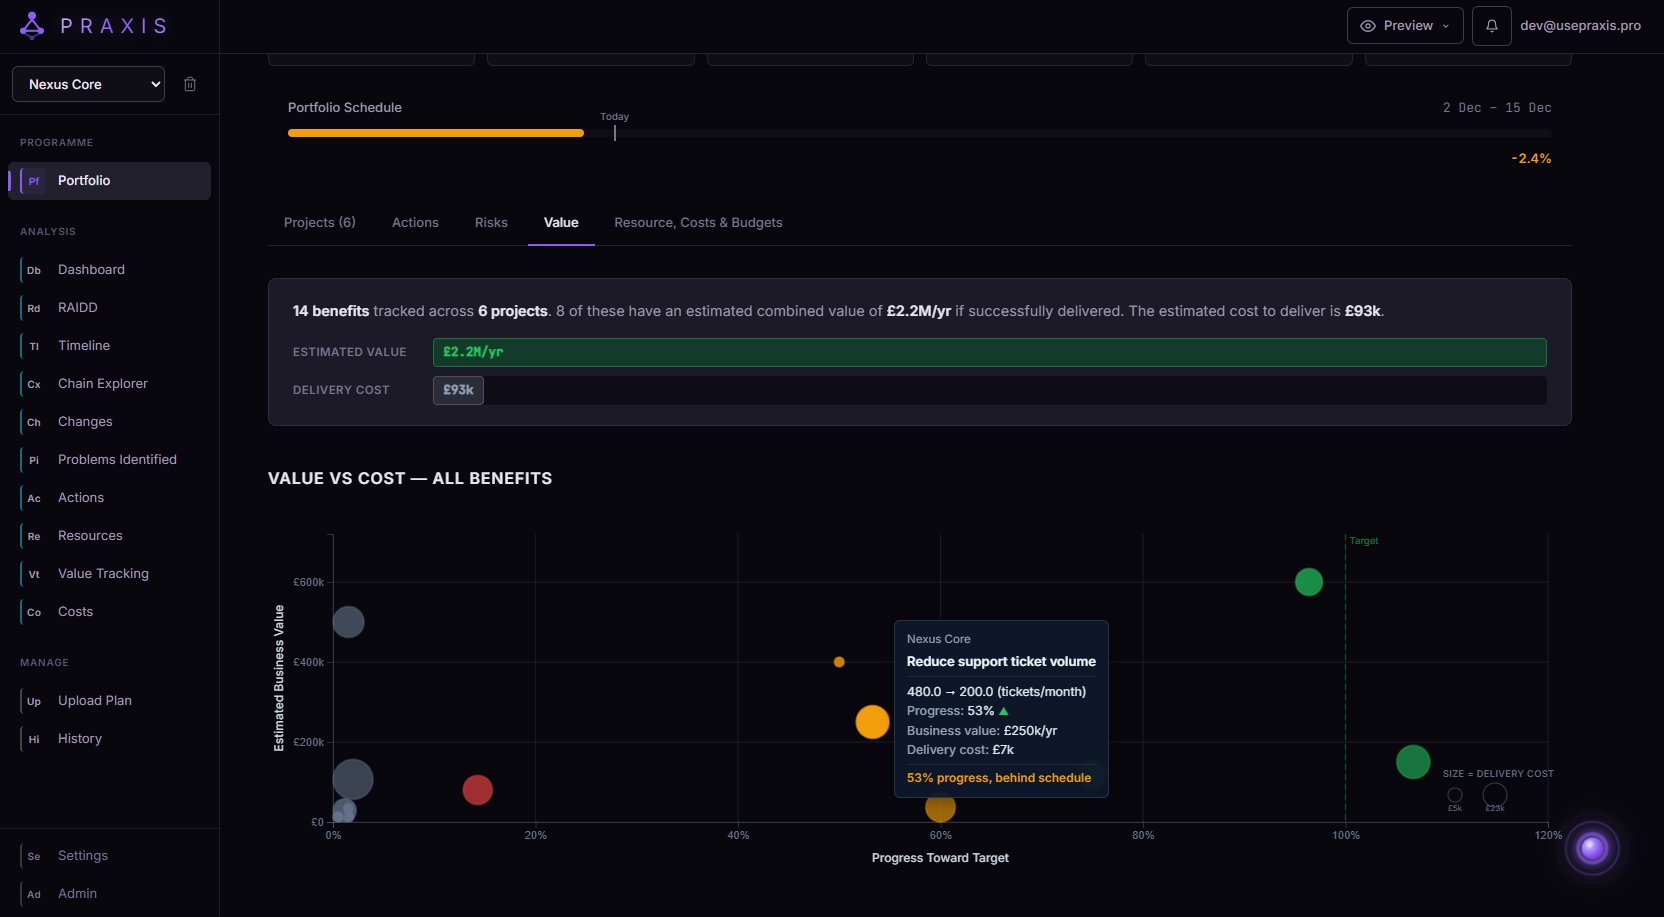
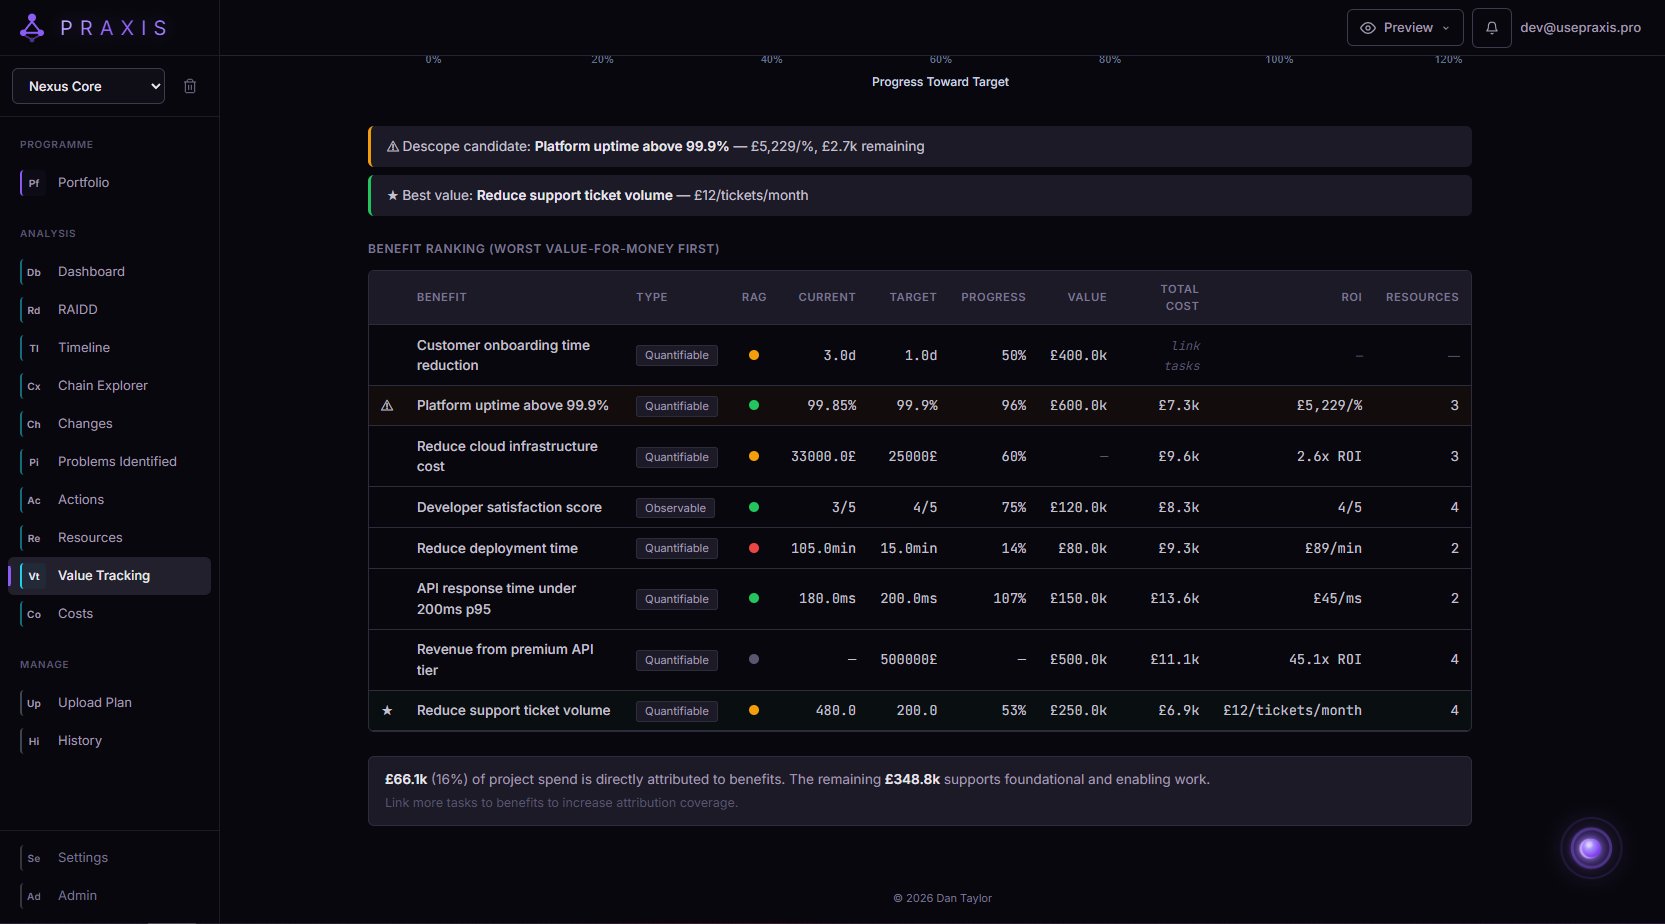
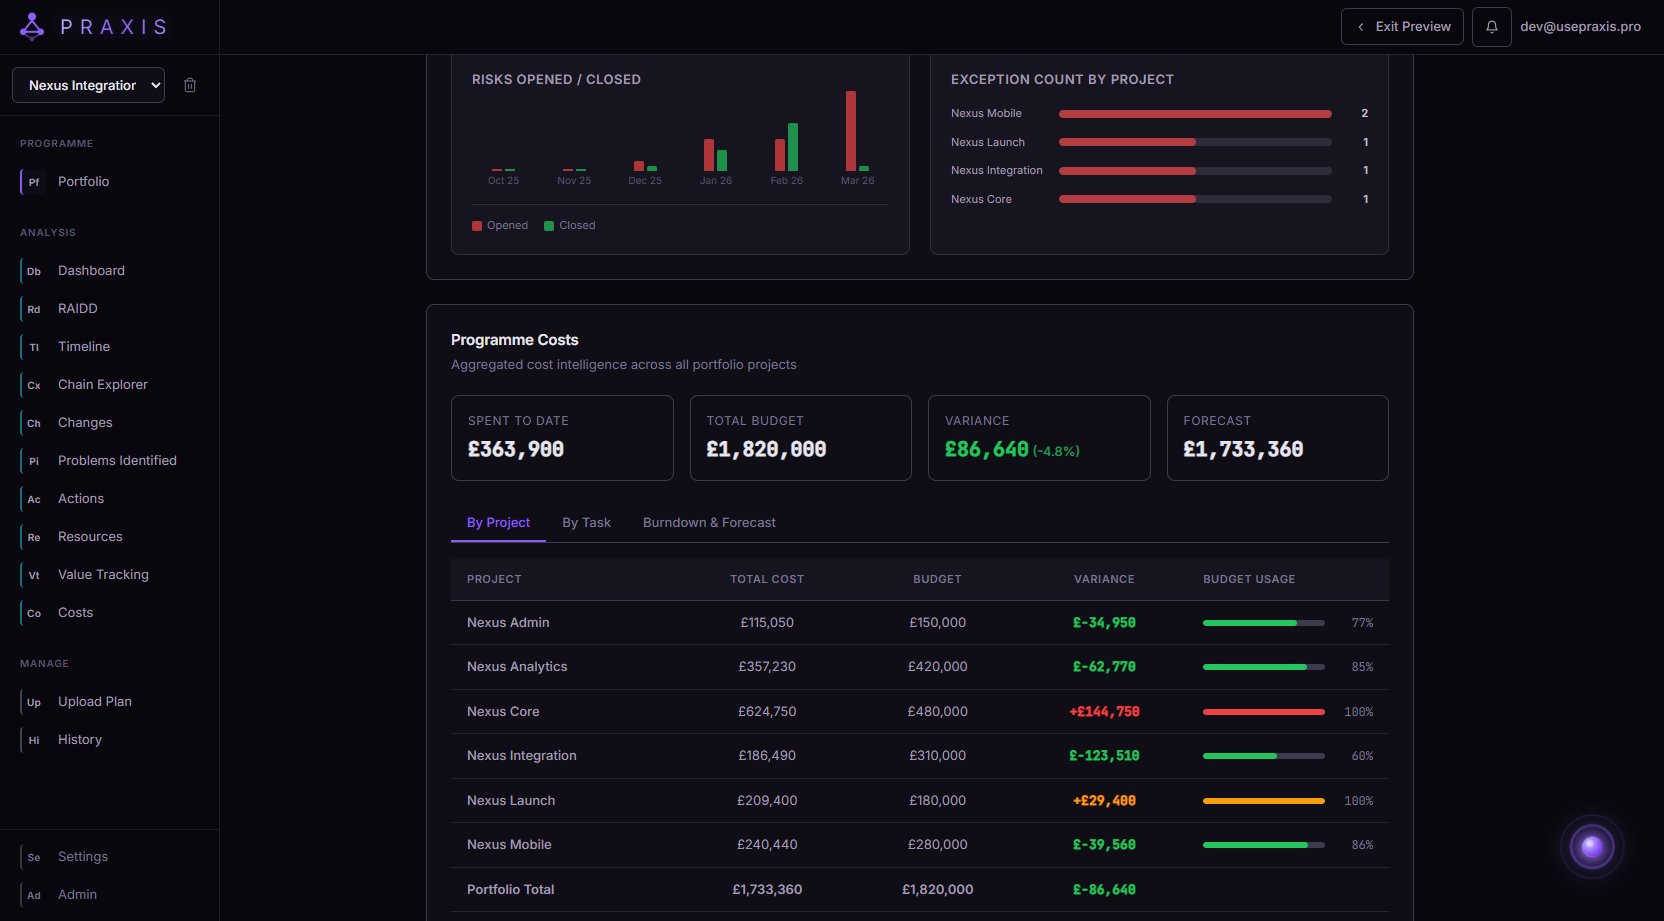
Tabs for Actions, Risks, Value, Resource, Costs & Budgets across the entire programme
Data from Excel, Jira, and Asana in the same portfolio